Hiiii Everyone in this article I am sharing how to use a Chart in an Android. This is very easy to implement it to Show The JSON data in graph chart, This tutorial is to help you learn chart view by developing an Android chart example APP using the library MPAndroidChart. It is a free Android chart view/graph view library using which you can draw line, bar, pie, charts.
MPAndroidChart also supports scaling, dragging and animations. It is a popular library available via GitHub. Earlier I have published another tutorial for creating Android APPs with a chart using AndroidPlot, you can refer that for an alternate library.
Before we proceed, let us add MPAndroidChart library in our example chart app. Open Build.gradle app module file and paste the following code inside dependencies
compile 'com.github.PhilJay:MPAndroidChart:v2.2.4'
compile 'com.android.volley:volley:1.0.0'
Add-In XML File For Pie Chart, Bar Chart, Line Chart.
 <com.github.mikephil.charting.charts.PieChart
android:layout_marginBottom="20dp"
android:layout_gravity="center"
android:id="@+id/barchart"
android:layout_width="match_parent"
android:layout_height="200dp">
</com.github.mikephil.charting.charts.PieChart>
<com.github.mikephil.charting.charts.BarChart
android:layout_marginBottom="20dp"
android:layout_gravity="center"
android:id="@+id/chart"
android:layout_width="match_parent"
android:layout_height="200dp">
</com.github.mikephil.charting.charts.BarChart>
<com.github.mikephil.charting.charts.LineChart
android:layout_gravity="center"
android:layout_marginBottom="20dp"
android:id="@+id/line"
android:layout_width="match_parent"
android:layout_height="200dp">
</com.github.mikephil.charting.charts.LineChart>
1. activity_graph.xml
<?xml version="1.0" encoding="utf-8"?>
<LinearLayout xmlns:android="http://schemas.android.com/apk/res/android"
    xmlns:app="http://schemas.android.com/apk/res-auto"
    xmlns:tools="http://schemas.android.com/tools"
    android:layout_width="match_parent"
    android:layout_height="match_parent"
    android:orientation="vertical"
    tools:context="com.codeplayon.Graph_Avtiv">

    <ScrollView
        android:layout_width="match_parent"
        android:layout_height="match_parent">

        <LinearLayout
            android:layout_width="match_parent"
            android:layout_height="wrap_content"
            android:orientation="vertical">

            <com.github.mikephil.charting.charts.PieChart
                android:layout_marginBottom="20dp"
                android:layout_gravity="center"
                android:id="@+id/barchart"
                android:layout_width="match_parent"
                android:layout_height="200dp">
            </com.github.mikephil.charting.charts.PieChart>

            <View
                android:layout_width="match_parent"
                android:layout_height="5dp"
                android:background="@android:color/darker_gray"/>

            <com.github.mikephil.charting.charts.BarChart
                android:layout_marginBottom="20dp"
                android:layout_gravity="center"
                android:id="@+id/chart"
                android:layout_width="match_parent"
                android:layout_height="200dp">
            </com.github.mikephil.charting.charts.BarChart>

            <View
                android:layout_width="match_parent"
                android:layout_height="5dp"
                android:background="@android:color/darker_gray"/>

            <com.github.mikephil.charting.charts.LineChart
                android:layout_gravity="center"
                android:layout_marginBottom="20dp"
                android:id="@+id/line"
                android:layout_width="match_parent"
                android:layout_height="200dp">
            </com.github.mikephil.charting.charts.LineChart>
        </LinearLayout>


        <!-- </android.support.v4.widget.SwipeRefreshLayout>-->
    </ScrollView>
</LinearLayout>
2. Open Your Java File And Add these Code In You Graph_Chart.Java File
public class Graph_Avtiv extends AppCompatActivity implements OnChartValueSelectedListener {
ProgressDialog progressDialog;
String a, b, c;
PieChart pieChart;
BarChart barChart;
LineChart lineChart;
SwipeRefreshLayout swipeRefreshLayout;
@Override
protected void onCreate(Bundle savedInstanceState) {
super.onCreate(savedInstanceState);
setContentView(R.layout.activity_graph__avtiv);
pieChart = (PieChart) findViewById(R.id.barchart);
// pieChart.setUsePercentValues(true);
barChart = (BarChart) findViewById(R.id.chart);
lineChart=(LineChart)findViewById(R.id.line);
RewardApi();
}
public void RewardApi() {
progressDialog = new ProgressDialog(this);
progressDialog.setMessage("Please wait...");
progressDialog.setCancelable(false);
progressDialog.setIndeterminate(true);
progressDialog.show();
StringRequest stringRequest = new StringRequest(Request.Method.POST,"http://codeplayon.com/service1.asmx/PointSummary", new Response.Listener<String>() {
@Override
public void onResponse(String response) {
try {
JSONObject jsonObject = new JSONObject(response);
progressDialog.dismiss();
String status = jsonObject.getString("status");
String mgs = jsonObject.getString("msg");
if (status.equals("1")) {
//swipeRefreshLayout.setRefreshing(false);
progressDialog.dismiss();
// Toast.makeText(getApplicationContext(),mgs,Toast.LENGTH_LONG).show();
a= jsonObject.getJSONObject("ot").getString("E");
b= jsonObject.getJSONObject("ot").getString("R");
c= jsonObject.getJSONObject("ot").getString("Balance");
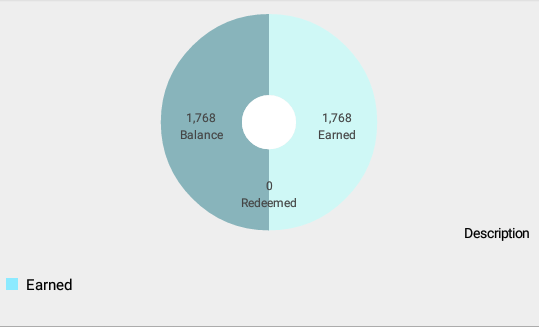
/*=======for pie chart=========*/
ArrayList<Entry> yvalues = new ArrayList<Entry>();
yvalues.add(new Entry(Float.parseFloat(a), 0));
yvalues.add(new Entry(Float.parseFloat(b), 1));
yvalues.add(new Entry(Float.parseFloat(c), 2));
PieDataSet dataSet = new PieDataSet(yvalues, "");
ArrayList<String> xVals = new ArrayList<String>();
xVals.add("Earned");
xVals.add("Redeemed");
xVals.add("Balance");
PieData data = new PieData(xVals, dataSet);
data.setValueFormatter(new DefaultValueFormatter(0));
pieChart.setData(data);
//pieChart.setDescription("This is Pie Chart");
pieChart.setDrawHoleEnabled(true);
pieChart.setTransparentCircleRadius(25f);
pieChart.setHoleRadius(25f);
dataSet.setColors(ColorTemplate.LIBERTY_COLORS);
data.setValueTextSize(8f);
data.setValueTextColor(Color.DKGRAY);
pieChart.setOnChartValueSelectedListener(Graph_Avtiv.this);
pieChart.animateXY(1400, 1400);
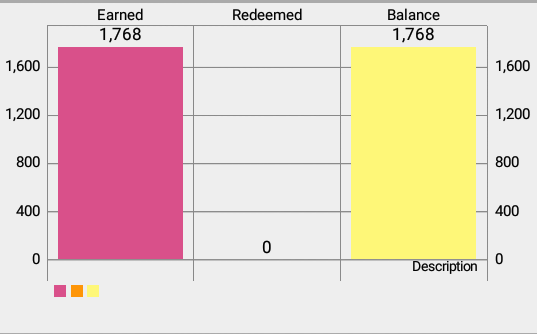
/*========for barchart========*/
ArrayList<BarEntry> entries = new ArrayList<>();
entries.add(new BarEntry(Float.parseFloat(a), 0));
entries.add(new BarEntry(Float.parseFloat(b), 1));
entries.add(new BarEntry(Float.parseFloat(c), 2));
BarDataSet dataset = new BarDataSet(entries, "");
ArrayList<String> labels = new ArrayList<String>();
labels.add("Earned");
labels.add("Redeemed");
labels.add("Balance");
BarData bardata = new BarData(labels, dataset);
dataset.setColors(ColorTemplate.JOYFUL_COLORS);
barChart.setData(bardata);
barChart.animateY(5000);
barChart.animateX(3000);
/*=======for line chart==========*/
ArrayList<Entry> entries1 = new ArrayList<>();
entries1.add(new Entry(Float.parseFloat(a), 0));
entries1.add(new Entry(Float.parseFloat(b), 1));
entries1.add(new Entry(Float.parseFloat(c), 2));
entries1.add(new Entry(0, 3));
LineDataSet dataset1 = new LineDataSet(entries1, "");
ArrayList<String> labels1 = new ArrayList<String>();
labels1.add("Earned");
labels1.add("Redeemed");
labels1.add("Balance");
labels1.add("Others");
LineData data1 = new LineData(labels1, dataset1);
dataset1.setColors(ColorTemplate.COLORFUL_COLORS);
lineChart.setData(data1);
lineChart.animateY(5000);
lineChart.animateX(3000);
/*=====for cubic form========*/
dataset1.setDrawCubic(true);
/*========Fill the color below the line=========*/
dataset1.setDrawFilled(true);
// lineChart.setDescription("Description");
} else {
// swipeRefreshLayout.setRefreshing(false);
progressDialog.dismiss();
Toast.makeText(getApplicationContext(), mgs, Toast.LENGTH_LONG).show();
}
} catch (JSONException e) {
e.printStackTrace();
}
}
},
new Response.ErrorListener() {
@Override
public void onErrorResponse(VolleyError error) {
//swipeRefreshLayout.setRefreshing(false);
progressDialog.dismiss();
Toast.makeText(Graph_Avtiv.this, "Internet Connection Lost,Please Try Again", Toast.LENGTH_LONG).show();
}
}) {
@Override
protected Map<String, String> getParams() throws AuthFailureError {
Map<String, String> map = new HashMap<String, String>();
map.put("UserId", "2");
return map;
}
};
RequestQueue requestQueue = Volley.newRequestQueue(this);
requestQueue.add(stringRequest);
}
@Override
public void onValueSelected(Entry e, int dataSetIndex, Highlight h) {
}
@Override
public void onNothingSelected() {
}
}


