Hello, in this blog post, we’ll learn how to make the Line Chart with Swift charts with the SwiftUI. Follow along on this blog and enjoy . In the end of that blog, you will find the entire code.
Simple line chart & Chart Chart graph in SwiftUI
The first step is to start by importing your chart. Create an Enum name LineChartType. We will then use that type of enum to create several plots on the graph.
The following enum comes with two types that have the property of color that is computed that will return the color for each enum type.
So, Let’s Start to create a line chart graph with simple date list. Start your Xcode and create a new swift class with the chartView and follow the below steps for make a simple Graph view in swiftUI.
The days of utilizing third-party libraries to display data are largely gone. Most recent versions of iOS (16.0) included Swift Charts and makes it easier for developers to show data in accordance with SwiftUI design guidelines.
Learn how to begin using the library by designing and creating a vertical bar graph. Start with a blank slate, design an entirely fresh Xcode project, specify the data model and data, then begin creating your chart after that. At the end of the process you’ll have an X-ray bar chart that has gradient colors, annotations, and custom labels for axis. Let’s get started!
Table of Contents:
- Bar Chart Data Model
- How to Create a Basic Bar Chart in SwiftUI
- Styling iOS Bar Charts — Everything You Need to Know
- Summing up SwiftUI Bar Charts
Bar Chart Data Model
If you’re starting with an uncluttered slate it is recommended that you create an entirely new Xcode project using your default ContentView.swift file for the sole view:
SwiftUI Line Chart Code snip
Chart{
   ForEach(simpleAnytic){item in
      LineMark(
          x: .value("date ", item.date,unit: .hour),
          y: .value("views", item.temperature ) )
                }
        }.padding(.all,15)
SwiftUI Bar Chart Code Snip
SwiftUI line Chart and Bar Chart Graph Example Code
Step 1: Create DataModel Class.
create a data model class a make a list with demo data for the line chart to show in the chart x and y axis.
import Foundation
import SwiftUI

struct ChartDate: Identifiable {

    var id = UUID().uuidString
    var date: Date
    var temperature: Double
    var animater: Bool = false

}

extension Date {
    func updateHour(value: Int)->Date{
        let calender = Calendar.current
        return calender.date(bySettingHour: value, minute: 0, second: 0, of: self) ?? .now
    }
}

let simple_date = [
    ChartDate(date: Date().updateHour(value: 6),temperature: 1230 ),
    ChartDate(date: Date().updateHour(value: 7),temperature: 1500 ),
    ChartDate(date: Date().updateHour(value: 8),temperature: 1030 ),
    ChartDate(date: Date().updateHour(value: 9),temperature: 1000 ),
    ChartDate(date: Date().updateHour(value: 10),temperature: 1930 ),
    ChartDate(date: Date().updateHour(value: 11),temperature: 1430 ),
    ChartDate(date: Date().updateHour(value: 12),temperature: 2230 ),
    ChartDate(date: Date().updateHour(value: 13),temperature: 1330 ),
    ChartDate(date: Date().updateHour(value: 14),temperature: 1930 ),

]
In this data list i add temperature data with the date and time.
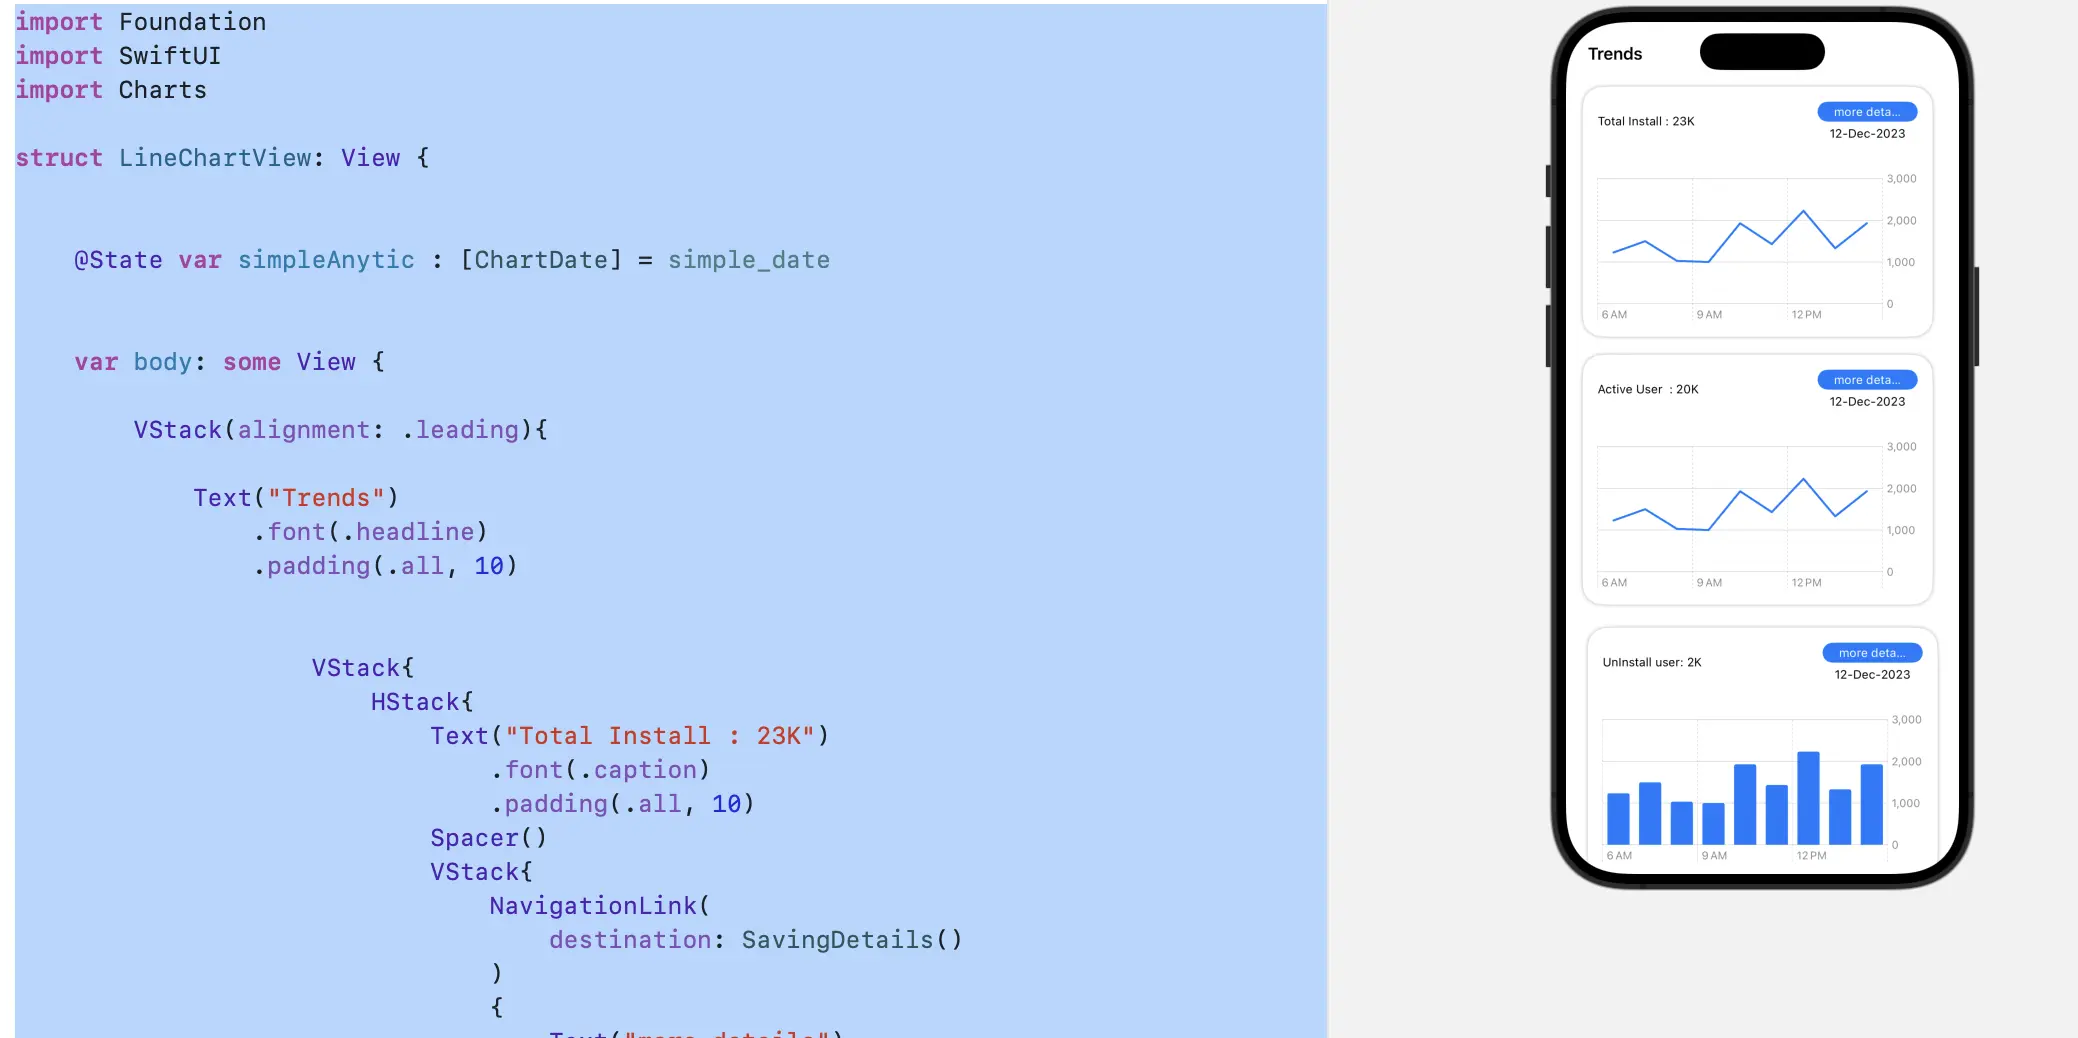
Step 2 : ChartListView Swift file to implement line chart
in this swift class i make UI for line chart using with VStack and then import the Swift Chart for showing list of data into chart. Follow below code snip.
import Foundation
import SwiftUI
import Charts

struct LineChartView: View {

    @State var simpleAnytic : [ChartDate] = simple_date

  var body: some View {

        VStack(alignment: .leading){

            Text("Trends")
                .font(.headline)
                .padding(.all, 10)

                    VStack{
                        HStack{
                            Text("Total Install : 23K")
                                .font(.caption)
                                .padding(.all, 10)
                            Spacer()
                            VStack{
                                NavigationLink(
                                    destination: SavingDetails()
                                )
                                {
                                    Text("more details")
                                        .font(.caption)
                                        .foregroundColor(.white)
                                        .padding()
                                        .frame(width: 100, height: 20)
                                        .background(Color.blue)
                                        .cornerRadius(15.0)
                                }


                                Text("12-Dec-2023")
                                    .font(.caption)
                            }
                            .padding(.all,10)
                        }.padding(.all,5)

                        Chart{
                            ForEach(simpleAnytic){item in
                                LineMark(
                                    x: .value("date ", item.date,unit: .hour),
                                    y: .value("views", item.temperature ) )
                            }
                        }.padding(.all,15)
                    }.frame(width:350, height: 250)
                        .background(
                            RoundedRectangle(cornerRadius: 20, style: .continuous)
                                .fill(.white.shadow(.drop(radius: 2))))
                        .padding(.all,5)

                    VStack{
                        HStack{
                            Text("Active User  : 20K")
                                .font(.caption)
                                .padding(.all, 10)
                            Spacer()
                            VStack{
                                NavigationLink(
                                    destination: SavingDetails()
                                )
                                {
                                    Text("more details")
                                        .font(.caption)
                                        .foregroundColor(.white)
                                        .padding()
                                        .frame(width: 100, height: 20)
                                        .background(Color.blue)
                                        .cornerRadius(15.0)
                                }
                                Text("12-Dec-2023")
                                   .font(.caption)
                            }
                            .padding(.all,10)
                        }.padding(.all,5)

                        Chart{
                            ForEach(simpleAnytic){item in
                                LineMark(
                                    x: .value("date ", item.date,unit: .hour),
                                    y: .value("views", item.temperature ) )

                            }

                        }.padding(.all,15)

                    }.frame(width:350 , height: 250)
                        .background(
                            RoundedRectangle(cornerRadius: 20, style: .continuous)
                                .fill(.white.shadow(.drop(radius: 2))))
                        .padding(.all,5)


                    VStack{
                        HStack{
                            Text("UnInstall user: 2K ")
                                .font(.caption)
                                .padding(.all, 10)
                            Spacer()
                            VStack{
                                NavigationLink(
                                    destination: SavingDetails()
                                )
                                {
                                    Text("more details")
                                        .font(.caption)
                                        .foregroundColor(.white)
                                        .padding()
                                        .frame(width: 100, height: 20)
                                        .background(Color.blue)
                                        .cornerRadius(15.0)
                                }

                                Text("12-Dec-2023")
                                    .font(.caption)
                            }
                            .padding(.all,10)
                        }.padding(.all,5)

                        Chart{
                            ForEach(simpleAnytic){item in
                                BarMark(
                                    x: .value("date ", item.date,unit: .hour),
                                    y: .value("views", item.temperature ) )
                            }
                        }.padding(.all,15)
                    }.frame(width:350 ,height: 250)
                        .background(
                            RoundedRectangle(cornerRadius: 20, style: .continuous)
                                .fill(.white.shadow(.drop(radius: 2))))
                        .padding(.all,10)
        }

    }
}

struct User_Previews: PreviewProvider {
    static var previews: some View {
        LineChartView()
    }
}
Read More Tutorial