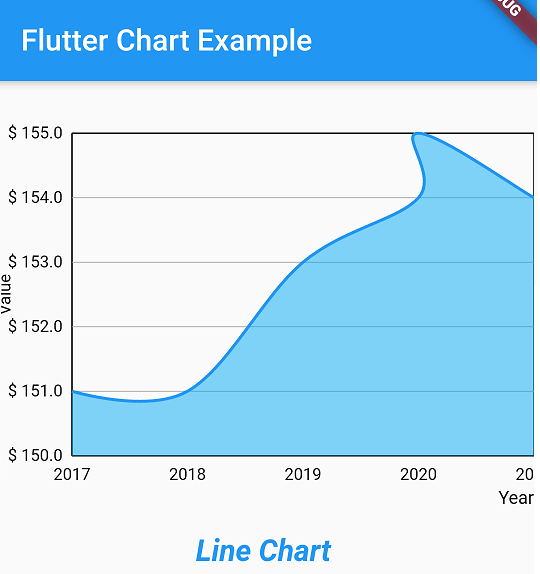
Hi, Flutter developer in this article we learn about the line chart. How to make Line Charts in Flutter. For if you are making a dashboard application for android and ioS where you can show data in a graph. Here is an example to learn how to make Line Charts in Flutter with static data in the graph.
Simple Line Chart Example.
So Let’s make a line graph with the fun we are here for learn share and explore new think. In this topic, we used a fl_chart library to show data on a line chart and making a static list of data to show that on the graph. So that if you have an existing project open it and if you have not created a flutter application and build it and follow the below simple steps.
How to make Line Charts in Flutter source code
Step:- 1 Add fl_chart library in your pubspec.yaml file.
dependencies:
  flutter:
    sdk: flutter


  # The following adds the Cupertino Icons font to your application.
  # Use with the CupertinoIcons class for iOS style icons.
  cupertino_icons: ^1.0.2
  fl_chart: ^0.35.0
add fl_chart and get pub dependency
Step:- 2 Follow these below codes for showing data online chart.
Hare, you can see full source code for making a chart field and showing data on line static data on a line chart.
import 'package:fl_chart/fl_chart.dart';
import 'package:flutter/material.dart';

void main() {
  runApp(MyApp());
}

class MyApp extends StatelessWidget {
  @override
  Widget build(BuildContext context) {
    return MaterialApp(
      home: HomePage(),
    );
  }
}


class HomePage extends StatelessWidget {
  @override
  Widget build(BuildContext context) {
    return Scaffold(
      appBar: AppBar(
          title: const Text('Flutter Chart Example'),
          backgroundColor: Colors.green
      ),
      body: Center(
        child: Column(
          mainAxisAlignment: MainAxisAlignment.center,
          children: <Widget>[
            LineCharts(),
            Padding(
                padding: const EdgeInsets.all(16.0),
                child: Text(
                    "Line Chart",
                    style: TextStyle(
                        fontSize: 20,
                        color: Colors.purple,
                        fontWeight: FontWeight.w700,
                        fontStyle: FontStyle.italic
                    )
                )
            ),
          ],
        ),
      ),
    );
  }
}

class LineCharts extends StatelessWidget {
  @override
  Widget build(BuildContext context) {
    const cutOffYValue = 0.0;
    const yearTextStyle =
    TextStyle(fontSize: 12, color: Colors.black);

    return SizedBox(
      width: 360,
      height: 250,
      child: LineChart(
        LineChartData(
          lineTouchData: LineTouchData(enabled: false),
          lineBarsData: [
            LineChartBarData(
              spots: [
                FlSpot(0, 1),
                FlSpot(1, 1),
                FlSpot(2, 3),
                FlSpot(3, 4),
                FlSpot(3, 5),
                FlSpot(4, 4)
              ],
              isCurved: true,
              barWidth: 2,
              colors: [
                Colors.black,
              ],
              belowBarData: BarAreaData(
                show: true,
                colors: [Colors.lightBlue.withOpacity(0.5)],
                cutOffY: cutOffYValue,
                applyCutOffY: true,
              ),
              aboveBarData: BarAreaData(
                show: true,
                colors: [Colors.lightGreen.withOpacity(0.5)],
                cutOffY: cutOffYValue,
                applyCutOffY: true,
              ),
              dotData: FlDotData(
                show: false,
              ),
            ),
          ],
          minY: 0,
          titlesData: FlTitlesData(
            bottomTitles: SideTitles(
                showTitles: true,
                reservedSize: 5,
                getTitles: (value) {
                  switch (value.toInt()) {
                    case 0:
                      return '2017';
                    case 1:
                      return '2018';
                    case 2:
                      return '2019';
                    case 3:
                      return '2020';
                    case 4:
                      return '2021';
                    default:
                      return '';
                  }
                }),
            leftTitles: SideTitles(
              showTitles: true,
              getTitles: (value) {
                return '\$ ${value + 150}';
              },
            ),
          ),
          axisTitleData: FlAxisTitleData(
              leftTitle: AxisTitle(showTitle: true, titleText: 'Value', margin: 10),
              bottomTitle: AxisTitle(
                  showTitle: true,
                  margin: 10,
                  titleText: 'Year',
                  textStyle: yearTextStyle,
                  textAlign: TextAlign.right)),
          gridData: FlGridData(
            show: true,
            checkToShowHorizontalLine: (double value) {
              return value == 1 || value == 2 || value == 3 || value == 4;
            },
          ),
        ),
      ),
    );
  }
}
after that run, your project and see the output if you are interested to learn more on flutter click here
Read More Tutorial


