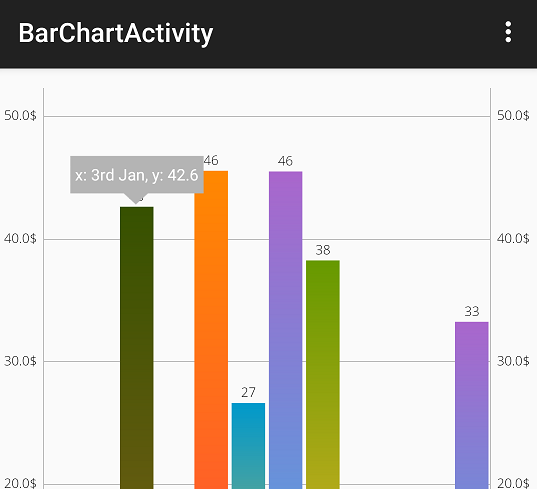
Hii Developer in this Android Tutorial, I am sharing how to make an Android bar chart with Tooltip example to show bar value in android. In this Android example, I am getting data for a rest API and API response we show in a bar chart. Add on this user can click on the Bar chart showing a Tooltip for Bar Value and Title.
Android bar chart with Tooltip example shows data with server API. In today’s customer requirements and user-friendly app-making I very difficult to show we can add a new thing with a bar chart to show data in Bar chart Tooltip. So Just Follow these Simple Steps for Do.
Step 1:- Add PhilJay MPAndroidChart Bar Chart Chart Dependency.
implementation 'com.github.PhilJay:MPAndroidChart:v3.1.0'
Step 2: Make a Bar Chart Layout in your XML file and add these.
<com.github.mikephil.charting.charts.BarChart
    android:id="@+id/Monitoring_Memory_PieChart"
    android:layout_width="match_parent"
    android:layout_height="match_parent"
    android:minHeight="320dp" />
Step 3: Implement a java class and add an API response on the Bar Chart.
public class Home extends AppCompatActivity implements OnChartValueSelectedListener {
BarChart BarChart;
ArrayList<DataObject> CPU_BarChart = new ArrayList<>();
ArrayList<String> serviceCPUStringList = new ArrayList<>();
@Override
protected void onCreate(Bundle savedInstanceState) {
    super.onCreate(savedInstanceState);
    setContentView(R.layout.activity_advanced_monitoring_home);
    FindViewById();
    androidx.appcompat.app.ActionBar actionBar = getSupportActionBar();
    actionBar.setHomeButtonEnabled(true);
    actionBar.setDisplayHomeAsUpEnabled(true);
    actionBar.setTitle("Codeplayon");
    BarChart =(BarChart)findViewById(R.id.Monitoring_CPU_PieChart);
    initializeCPUBarChart()
    Service_CpuCout();
}
private void initializeCPUBarChart() {
        BarChart.getDescription().setEnabled(false);
        BarChart.setPinchZoom(true);
        BarChart.getAxisLeft().setDrawGridLines(false);
        BarChart.getAxisRight().setDrawGridLines(false);
        BarChart.getAxisRight().setEnabled(false);
        BarChart.animateY(1500);
        BarChart.getLegend().setEnabled(false);
        BarChart.getAxisRight().setDrawLabels(false);
        BarChart.setDoubleTapToZoomEnabled(false);
        Monitoring_CPU_BarChart.setOnChartValueSelectedListener(this);
        Monitoring_CPU_BarChart.setDrawBarShadow(false);
        BarChart.setDrawValueAboveBar(true);
        BarChart.getDescription().setEnabled(false);
        // scaling can now only be done on x- and y-axis separately
        BarChart.setDrawGridBackground(false);
        // chart.setDrawYLabels(false);
        XAxis xAxis = BarChart.getXAxis();
        xAxis.setPosition(XAxis.XAxisPosition.BOTTOM);
//        xAxis.setTypeface(tfLight);
        xAxis.setDrawGridLines(false);
        xAxis.setGranularity(1f); // only intervals of 1 day
        xAxis.setLabelCount(7);
        ValueFormatter custom = new MyValueFormatter("");
        YAxis leftAxis = BarChart.getAxisLeft();
//        leftAxis.setTypeface(tfLight);
        leftAxis.setLabelCount(8, false);
        leftAxis.setValueFormatter(custom);
        leftAxis.setPosition(YAxis.YAxisLabelPosition.OUTSIDE_CHART);
        leftAxis.setSpaceTop(15f);
        leftAxis.setAxisMinimum(0f); // this repla
    }
private void Service_CpuCout() {
        loading_CPU_BarChart.setVisibility(View.VISIBLE);
        // Enter the correct url for your api service site
        JsonObjectRequest jsonObjectRequest = new JsonObjectRequest(Request.Method.GET, ConfiURL.Top_Five_ServiceCPU+"?serviceName=CPU&noOfHost=5&graphType=SRV", null,
                new Response.Listener<JSONObject>() {
                    @Override
                    public void onResponse(JSONObject response) {
//                        Toast.makeText(mActivity, "String Response : " + response.toString(), Toast.LENGTH_LONG).show();
                        try {
                            loading_CPU_BarChart.setVisibility(View.GONE);
                            CUPRetry_Button.setVisibility(View.GONE);
                            Log.d("JSON", String.valueOf(response));
                            String Error = response.getString("httpStatus");
                            if (Error.equals("OK")) {
                                JSONObject body = response.getJSONObject("body");
                                JSONObject Response =body.getJSONObject("Response");
                                JSONArray  Services = Response.getJSONArray("Services");
                                for (int i = 0; i < Services.length(); i++) {
                                    JSONObject json_data = Services.getJSONObject(i);
                                    JSONArray service = json_data.getJSONArray("service");
                                    onPostServiceCpulist(service);
                                }
                            }else if(Error.equalsIgnoreCase("UNAUTHORIZED")){

                            }
                        } catch (JSONException e) {
                            e.printStackTrace();
                            loading_CPU_BarChart.setVisibility(View.GONE);
                        }
                    }
                }, error -> {
            VolleyLog.d("Error", "Error: " + error.getMessage());
            loading_CPU_BarChart.setVisibility(View.GONE);
            Monitoring_CPU_BarChart.setNoDataText("No chart data available. kindly refresh it");
            CUPRetry_Button.setVisibility(View.VISIBLE);
            if (error instanceof TimeoutError || error instanceof NoConnectionError) {


            } else if (error instanceof AuthFailureError) {

                //TODO
            } else if (error instanceof ServerError) {

                //TODO
            } else if (error instanceof NetworkError) {

                //TODO
            } else if (error instanceof ParseError) {

            }
        }) {
            @Override
            public String getBodyContentType() {
                return "application/json; charset=utf-8";
            }

            @Override
            public Map<String, String> getHeaders() throws AuthFailureError {
                HashMap<String, String> headers = new HashMap<String, String>();
                headers.put("Authorization", new SessionManagement().getSavedToken(AdvancedMonitoringHome.this));
                return headers;
            }
        };
        requestQueue = Volley.newRequestQueue(getApplicationContext());
        jsonObjectRequest.setRetryPolicy(new DefaultRetryPolicy(10000, DefaultRetryPolicy.DEFAULT_MAX_RETRIES, DefaultRetryPolicy.DEFAULT_BACKOFF_MULT));
        requestQueue.add(jsonObjectRequest);
    }

    protected void onPostServiceCpulist(JSONArray result) {
        //this method will be running on UI thread
        ArrayList<DataObject> data = new ArrayList<>();
        data.equals(null);
        try {
            // Extract data from json and store into ArrayList as class objects
            for (int i = 0; i < result.length(); i++) {
                JSONObject json_data = result.getJSONObject(i);
                DataObject report = new DataObject();
                report.mText2 = json_data.getString("perfometer");
                String thisString=json_data.getString("alias");
                String first ;//"hello"
                if (thisString.length() > 7)
                {
                    first = thisString.substring(0, 7);
                }
                else
                {
                    first = thisString;
                }

                report.mText3 = first+"...";
                data.add(report);
                serviceCPUStringList.add(report.mText3);
            }
            CPU_BarChart = data;
            createCPUBarChart(CPU_BarChart);

        } catch (JSONException e) {
        }
    }
    private void createCPUBarChart(ArrayList<DataObject> severityListServer) {
        ArrayList<BarEntry> values = new ArrayList<>();

        for (int i = 0; i < severityListServer.size(); i++) {
            DataObject dataObject = severityListServer.get(i);
            values.add(new BarEntry(i, Integer.parseInt(dataObject.mText2)));
        }

        BarDataSet set1;

        if (BarChart.getData() != null && BarChart.getData().getDataSetCount() > 0) {
            set1 = (BarDataSet) BarChart.getData().getDataSetByIndex(0);
            set1.setValues(values);
            BarChart.getData().notifyDataChanged();
            BarChart.notifyDataSetChanged();
        } else {
            set1 = new BarDataSet(values, "Data Set");
            set1.setColors(SessionManagement.BarCHART_COLORS_Top5);
            set1.setDrawValues(true);
            ArrayList<IBarDataSet> dataSets = new ArrayList<>();
            dataSets.add(set1);
            YAxis y = Monitoring_CPU_BarChart.getAxisLeft();
            y.setAxisMinValue(0);
            y.setLabelCount(4);
            y.setAxisMaxValue(120);
            BarData data = new BarData(dataSets);
            BarChart.setData(data);
            BarChart.setFitBars(true);
            XAxis xAxis = Monitoring_CPU_BarChart.getXAxis();
            xAxis.setGranularity(1f);
            xAxis.setGranularityEnabled(true);
            xAxis.setCenterAxisLabels(false);
            xAxis.setValueFormatter(new IndexAxisValueFormatter(serviceCPUStringList));//setting String values in Xaxis
            BarChart.invalidate();
            XYMarkerView mv = new XYMarkerView(this,new IndexAxisValueFormatter(serviceCPUStringList) );
            mv.setChartView(BarChart); // For bounds control
            BarChart.setMarker(mv);

        }
    }
Step 4: Make a java class with the name XYMarkerView.
In these classes, we create a Tooltip marker showing on click on Bar chart slice showing title and value in Android.
import android.content.Context;
import android.widget.TextView;

import com.github.mikephil.charting.components.MarkerView;
import com.github.mikephil.charting.data.Entry;
import com.github.mikephil.charting.formatter.ValueFormatter;
import com.github.mikephil.charting.highlight.Highlight;
import com.github.mikephil.charting.utils.MPPointF;
import com.netmagic.netmagicntt.R;

import java.text.DecimalFormat;

public class XYMarkerView extends MarkerView {

    private final TextView tvContent;
    private final ValueFormatter xAxisValueFormatter;

    private final DecimalFormat format;

    public XYMarkerView(Context context, ValueFormatter xAxisValueFormatter) {
        super(context, R.layout.custom_marker_view);

        this.xAxisValueFormatter = xAxisValueFormatter;
        tvContent = findViewById(R.id.tvContent);
        format = new DecimalFormat("###.0");
    }

    // runs every time the MarkerView is redrawn, can be used to update the
    // content (user-interface)
    @Override
    public void refreshContent(Entry e, Highlight highlight) {

//        tvContent.setText(String.format("Name: %s, Value: %s", xAxisValueFormatter.getFormattedValue(e.getX()), format.format(e.getY())));

        tvContent.setText(String.format(" Value: %s", format.format(e.getY())));

        super.refreshContent(e, highlight);
    }

    @Override
    public MPPointF getOffset() {
        return new MPPointF(-(getWidth() / 2), -getHeight());
    }
}