Hi Everyone in this, Flutter tutorial we learn about Flutter Pie Chart Example. How to drow a pie chart in flutter so let’s begging to learn share and explore your knowledge in a flutter. So In this article, we learn the flutter chart to grow the value on the chart and show the label name. Also, we show the Cart value on Pie slice.
If you want to make a dashboard app for both Android and ioS using flutter. So this tutorial for you here you can learn how to use a pie chart in a flutter. You can Show static data on pie char simple code base and you can get full source code. Flutter Pie Chart Example. In this article, we used pie_chart dependency to show Pie charts in a flutter. Like MP library to use in Android and Ios native App.
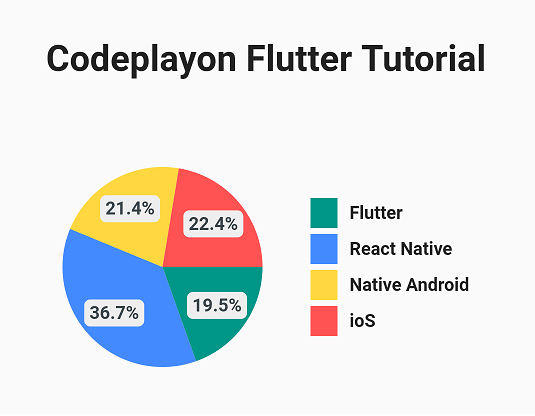
How to draw a Pie Chart in Flutter
So let’s do that Stat your android studio and make a simple flutter project. and Open your main dart file and first clear all code on the main dart file. If you want to add the and exciting file you user chart method in your existing file.
Step: 1 Add Despandance in your pubspec yaml file.
Add the chart dependence in your pubspec.yaml file and get pub dependence.
dependencies:
  flutter:
    sdk: flutter
  # The following adds the Cupertino Icons font to your application.
  # Use with the CupertinoIcons class for iOS style icons.
  cupertino_icons: ^1.0.2
  pie_chart: ^3.1.1
Step 2: Open Your Main Dart File and use the below code.
used the below code to show the pie chart in your flutter App in UI You can see a button click on the button Pie chart is load with the data.
import 'package:flutter/material.dart';
import 'package:pie_chart/pie_chart.dart'; // import the package

void main() => runApp(MyApp());

class MyApp extends StatelessWidget {
  @override
  Widget build(BuildContext context) {
    return MaterialApp(
      debugShowCheckedModeBanner: false,
      title: 'Pie Chart Demo',
      theme: ThemeData(
        primarySwatch: Colors.blue,
      ),
      home: MyHomePage(title: 'Pie Chart Demo'),
    );
  }
}

class MyHomePage extends StatefulWidget {
  MyHomePage({Key key, this.title}) : super(key: key);
  final String title;

  @override
  _MyHomePageState createState() => _MyHomePageState();
}

class _MyHomePageState extends State<MyHomePage> {
  Map<String, double> data = new Map();
  bool _loadChart = false;
  @override
  void initState() {
    data.addAll({
      'Flutter': 37136,
      'React Native': 69687,
      'Native Android': 40609,
      'ioS': 42544
    });
    super.initState();
  }

  List<Color> _colors = [
    Colors.teal,
    Colors.blueAccent,
    Colors.amberAccent,
    Colors.redAccent
  ];

  @override
  Widget build(BuildContext context) {
    return Scaffold(
      appBar: AppBar(
        title: Text(widget.title),
      ),
      body: Center(
        child: Column(
          children: <Widget>[
            SizedBox(
              height: 50,
            ),
            Text(
              'Number of Questions asked on StackOverflow',
              textAlign: TextAlign.center,
              style: TextStyle(fontSize: 24, fontWeight: FontWeight.bold),
            ),
            SizedBox(
              height: 50,
            ),
            _loadChart ? PieChart(
              dataMap: data,
              colorList:
              _colors, // if not declared, random colors will be chosen
              animationDuration: Duration(milliseconds: 1500),
              chartLegendSpacing: 32.0,
              chartRadius: MediaQuery.of(context).size.width /
                  2.7, //determines the size of the chart
              showChartValuesInPercentage: true,
              showChartValues: true,
              showChartValuesOutside: false,
              chartValueBackgroundColor: Colors.grey[200],
              showLegends: true,
              legendPosition:
              LegendPosition.right, //can be changed to top, left, bottom
              decimalPlaces: 1,
              showChartValueLabel: true,
              initialAngle: 0,
              chartValueStyle: defaultChartValueStyle.copyWith(
                color: Colors.blueGrey[900].withOpacity(0.9),
              ),
              chartType: ChartType.disc, //can be changed to ChartType.ring
            ) : SizedBox(
              height: 150,
            ),
            SizedBox(
              height: 50,
            ),
            RaisedButton(
              color: Colors.blue,
              child: Text('Click to Show Chart', style: TextStyle(
                  color: Colors.white
              ),),
              onPressed: () {
                setState(() {
                  _loadChart = true;
                });
              },

            ),
          ],
        ),
      ),
    );
  }
}
Run your project and get output and click on the show chart button see chart UI. If you want more Flutter tutorials to learn Click Here