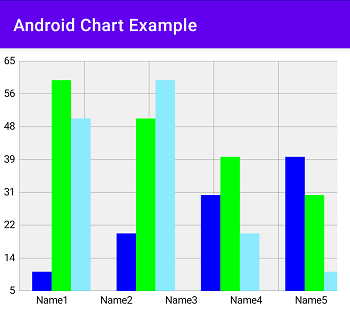
In This Article, we discuss Android how uses Group Bar Chart with MPAndroidChart Library. Bar charts are most useful for Dashboard App and showing a comparison between different groups of numerical data or to track changes to numerical data.
MPAndroidChart is the leading open-source free-to-use native charting library for Android and ioS that supports many different chart types including line charts, bar charts, combined line, and Bar charts, Pie charts, bubble charts, and others.
How to Display a Group Bar Chart in Your Android App
To display a bar chart in your Android app you will need to follow these steps.
- Select a charting library for Android, in this tutorial we use MPAndroidChart
- Add the dependencies for MPAndroidChart to your project
- Add the bar chart to your layout
- Configure the appearance of the bar chart
- Create the data set to show in the bar chart
So in this article, I will take you through a detailed step-by-step guide to create Group bar charts in your Android app using the MPAndroidChart. So Let’s Start on Project
Step 1: Create an Android Project and Configure MPAndroidChart Library.
So Let’s Create your project and if you have Alrday a project to configure the library follow these steps.
Add Library on your Project Base Gradle File add these codes.
allprojects {
    repositories {
        google()
        jcenter()
        maven { url 'https://jitpack.io' }
    }
}
And Add This for your App Base Gradle file.
dependencies {

    implementation 'androidx.appcompat:appcompat:1.2.0'
    implementation 'com.google.android.material:material:1.2.1'
    implementation 'androidx.constraintlayout:constraintlayout:2.0.4'
    testImplementation 'junit:junit:4.+'
    androidTestImplementation 'androidx.test.ext:junit:1.1.2'
    androidTestImplementation 'androidx.test.espresso:espresso-core:3.3.0'
    implementation 'com.github.PhilJay:MPAndroidChart:v3.1.0'
}
After adding library Sync you project for the download library file.
Step 2: Add Bar Chart Layout in Your Layout File.
<com.github.mikephil.charting.charts.BarChart
    android:id="@+id/bar_chart"
    android:layout_width="match_parent"
    android:layout_weight="1"
    android:layout_height="300dp"/>
Add these layout codes in your XML file where you want to show GroupBar chat. Add these bar chart layout and Implement in your Java file.
Step 3: Group BarChart Implication on Java file.
public class MainActivity extends AppCompatActivity {

    BarChart mChart;


    @Override
    protected void onCreate(Bundle savedInstanceState) {
        super.onCreate(savedInstanceState);
        setContentView(R.layout.activity_main);

        GroupBarChart();

    }


    public void GroupBarChart(){
        mChart = (BarChart) findViewById(R.id.bar_chart);
        mChart.setDrawBarShadow(false);
        mChart.getDescription().setEnabled(false);
        mChart.setPinchZoom(false);
        mChart.setDrawGridBackground(true);
        // empty labels so that the names are spread evenly
        String[] labels = {"", "Name1", "Name2", "Name3", "Name4", "Name5", ""};
        XAxis xAxis = mChart.getXAxis();
        xAxis.setCenterAxisLabels(true);
        xAxis.setPosition(XAxis.XAxisPosition.BOTTOM);
        xAxis.setDrawGridLines(true);
        xAxis.setGranularity(1f); // only intervals of 1 day
        xAxis.setTextColor(Color.BLACK);
        xAxis.setTextSize(12);
        xAxis.setAxisLineColor(Color.WHITE);
        xAxis.setAxisMinimum(1f);
        xAxis.setValueFormatter(new IndexAxisValueFormatter(labels));

        YAxis leftAxis = mChart.getAxisLeft();
        leftAxis.setTextColor(Color.BLACK);
        leftAxis.setTextSize(12);
        leftAxis.setAxisLineColor(Color.WHITE);
        leftAxis.setDrawGridLines(true);
        leftAxis.setGranularity(2);
        leftAxis.setLabelCount(8, true);
        leftAxis.setPosition(YAxis.YAxisLabelPosition.OUTSIDE_CHART);

        mChart.getAxisRight().setEnabled(false);
        mChart.getLegend().setEnabled(false);

        float[] valOne = {10, 20, 30, 40, 50};
        float[] valTwo = {60, 50, 40, 30, 20};
        float[] valThree = {50, 60, 20, 10, 30};

        ArrayList<BarEntry> barOne = new ArrayList<>();
        ArrayList<BarEntry> barTwo = new ArrayList<>();
        ArrayList<BarEntry> barThree = new ArrayList<>();
        for (int i = 0; i < valOne.length; i++) {
            barOne.add(new BarEntry(i, valOne[i]));
            barTwo.add(new BarEntry(i, valTwo[i]));
            barThree.add(new BarEntry(i, valThree[i]));
        }

        BarDataSet set1 = new BarDataSet(barOne, "barOne");
        set1.setColor(Color.BLUE);
        BarDataSet set2 = new BarDataSet(barTwo, "barTwo");
        set2.setColor(Color.MAGENTA);
        BarDataSet set3 = new BarDataSet(barThree, "barTwo");
        set2.setColor(Color.GREEN);

        set1.setHighlightEnabled(false);
        set2.setHighlightEnabled(false);
        set3.setHighlightEnabled(false);
        set1.setDrawValues(false);
        set2.setDrawValues(false);
        set3.setDrawValues(false);

        ArrayList<IBarDataSet> dataSets = new ArrayList<IBarDataSet>();
        dataSets.add(set1);
        dataSets.add(set2);
        dataSets.add(set3);
        BarData data = new BarData(dataSets);
        float groupSpace = 0.4f;
        float barSpace = 0f;
        float barWidth = 0.3f;
        // (barSpace + barWidth) * 2 + groupSpace = 1
        data.setBarWidth(barWidth);
        // so that the entire chart is shown when scrolled from right to left
        xAxis.setAxisMaximum(labels.length - 1.1f);
        mChart.setData(data);
        mChart.setScaleEnabled(false);
        mChart.setVisibleXRangeMaximum(6f);
        mChart.groupBars(1f, groupSpace, barSpace);
        mChart.invalidate();

    }
}
In your Java file you can find the view id for your bar chart and after that create a method for Customize your Bar chart to Group BarChart. For Group BarChart Create a Group of Chart Data so making Data entry for this hare i am Use three Bar so that We use two bar entry data.
If you Want to more Group on barChart you can create Multupal Bar Entry And add it in BarChart Data hare we have used Three Bar entry