Hii Developer in the Android Example we make solution for a dashboard App to create a multiple color stacked bar chart using MPAndroidChart for Android app. So in these Android solution like i have a multiple value and show on bar chart with different color on a single bar with the value.
To display a bar chart in your Android app you will need to follow these steps.
- Select a chart library for Android, in this tutorial we use MPAndroidChart
- Add dependencies for MPAndroidChart to your project
- Add the barchart to your activity or fragment layout
- Configure the appearance of the barchart
- Create the data set to show data in the bar chart
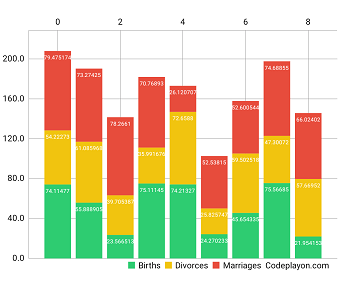
The above chart is only sample, I want three colours in each bar (stacked). I have already made a bar chart with separate colors, but can’t make such multiple coloured chart. so after a log try and do it.
Android Stacked Bar Chart Using MPAndroidChart
So Let’s make a Android Stacked Bart Chart using MPAndroidChart to showing multiple color on bar chart with stacked.
Firstly create an android project with empty activity and if you already have a project create a activity for stacked bar chart and the MPAndroid Chart Library in you gradle file .
MP Android Chart Library
repositories {
    maven { url 'https://jitpack.io' }
}

dependencies {
    implementation 'com.github.PhilJay:MPAndroidChart:v3.1.0'
}
bar_chart_activity.xml
in your activity xml file add bar chart layout. copy below code.
<com.github.mikephil.charting.charts.BarChart
    android:id="@+id/bar_chart1"
    android:layout_width="match_parent"
    android:layout_weight="1"
    android:layout_marginTop="10dp"
    android:layout_marginBottom="10dp"
    android:layout_height="300dp"/>
BarChart.java file source code
follow these code for you java file implementation for you bar chart showing data on bar with there color.
public class MainActivity extends AppCompatActivity {


    BarChart mChart1;


    @Override
    protected void onCreate(Bundle savedInstanceState) {
        super.onCreate(savedInstanceState);
        setContentView(R.layout.activity_main);


        MultipalColor();
    }


    public void MultipalColor(){
        mChart1 = findViewById(R.id.bar_chart1);

        mChart1.getDescription().setEnabled(false);

        // if more than 60 entries are displayed in the chart, no values will be
        // drawn
        mChart1.setMaxVisibleValueCount(40);

        // scaling can now only be done on x- and y-axis separately
        mChart1.setPinchZoom(false);

        mChart1.setDrawGridBackground(false);
        mChart1.setDrawBarShadow(false);

        mChart1.setDrawValueAboveBar(false);
        mChart1.setHighlightFullBarEnabled(false);

        // change the position of the y-labels
        YAxis leftAxis = mChart1.getAxisLeft();
        leftAxis.setValueFormatter(new MyAxisValueFormatter());
        leftAxis.setAxisMinimum(0f); // this replaces setStartAtZero(true)
        mChart1.getAxisRight().setEnabled(false);

        XAxis xLabels = mChart1.getXAxis();
        xLabels.setPosition(XAxis.XAxisPosition.TOP);

        // chart.setDrawXLabels(false);
        // chart.setDrawYLabels(false);

        // setting data;

        Legend l = mChart1.getLegend();
        l.setVerticalAlignment(Legend.LegendVerticalAlignment.BOTTOM);
        l.setHorizontalAlignment(Legend.LegendHorizontalAlignment.RIGHT);
        l.setOrientation(Legend.LegendOrientation.HORIZONTAL);
        l.setDrawInside(false);
        l.setFormSize(8f);
        l.setFormToTextSpace(4f);
        l.setXEntrySpace(6f);

        ArrayList<BarEntry> yVals1 = new ArrayList<BarEntry>();

        for (int i = 0; i < 8 + 1; i++) {
            float mult = (60);
            float val1 = (float) (Math.random() * mult) + mult / 3;
            float val2 = (float) (Math.random() * mult) + mult / 3;
            float val3 = (float) (Math.random() * mult) + mult / 3;

            yVals1.add(new BarEntry(i,
                    new float[]{val1, val2, val3},
                    getResources().getDrawable(R.drawable.icons_sneakers)));
        }

        BarDataSet set1;

        if (mChart1.getData() != null &&
                mChart1.getData().getDataSetCount() > 0) {
            set1 = (BarDataSet) mChart1.getData().getDataSetByIndex(0);
            set1.setValues(yVals1);
            mChart1.getData().notifyDataChanged();
            mChart1.notifyDataSetChanged();
        } else {
            set1 = new BarDataSet(yVals1, "Codeplayon.com");
            set1.setDrawIcons(false);
            set1.setColors(getColors());
            set1.setStackLabels(new String[]{"Births", "Divorces", "Marriages"});

            ArrayList<IBarDataSet> dataSets = new ArrayList<IBarDataSet>();
            dataSets.add(set1);

            BarData data = new BarData(dataSets);
            data.setValueFormatter(new MyValueFormatter());
            data.setValueTextColor(Color.WHITE);

            mChart1.setData(data);
        }

        mChart1.setFitBars(true);
        mChart1.invalidate();
    }

    private int[] getColors() {

        // have as many colors as stack-values per entry
        int[] colors = new int[3];

        System.arraycopy(ColorTemplate.MATERIAL_COLORS, 0, colors, 0, 3);

        return colors;
    }


}