Hi in this swiftui iOS article we are lean about the Line chart in swiftui using charts APi. Chart is graphic view of data to representing data to user more interesting way. Today most of App are showing details to user graphical so user can easy understand.
SwiftUI Line chart is a great tool to use. A line chart, also known as a line graph or a time series chart, is a type of data imagine that displays information as a series of data can connect to each other points by straight lines. Also read for more ios documents
Create a Line Chart in SwiftUI using Charts API
So let’s start to learn and share create your project in XCode is you have have an existing one create a new Swift file with Line chart. and import the charts APi with import Charts . After that let’s create a model class for the data.
Create a Swiftui Data Model Class
let’s create a new swift data model class with the name of ChartDate and adding some dummy data in the list.
import Foundation
import SwiftUI

struct ChartDate: Identifiable {

    var id = UUID().uuidString
    var date: Date
    var temperature: Double
    var animater: Bool = false
}

extension Date {
    func updateHour(value: Int)->Date{
        let calender = Calendar.current
        return calender.date(bySettingHour: value, minute: 0, second: 0, of: self) ?? .now
    }
}

let simple_date = [
    ChartDate(date: Date().updateHour(value: 6),temperature: 1230 ),
    ChartDate(date: Date().updateHour(value: 7),temperature: 1500 ),
    ChartDate(date: Date().updateHour(value: 8),temperature: 1030 ),
    ChartDate(date: Date().updateHour(value: 9),temperature: 1000 ),
    ChartDate(date: Date().updateHour(value: 10),temperature: 1930 ),
    ChartDate(date: Date().updateHour(value: 11),temperature: 1430 ),
    ChartDate(date: Date().updateHour(value: 12),temperature: 2230 ),
    ChartDate(date: Date().updateHour(value: 13),temperature: 1330 ),
    ChartDate(date: Date().updateHour(value: 14),temperature: 1930 ),
]
In the chart list i add ChartData with date and temperature value.
Create a Chart View and Add Data
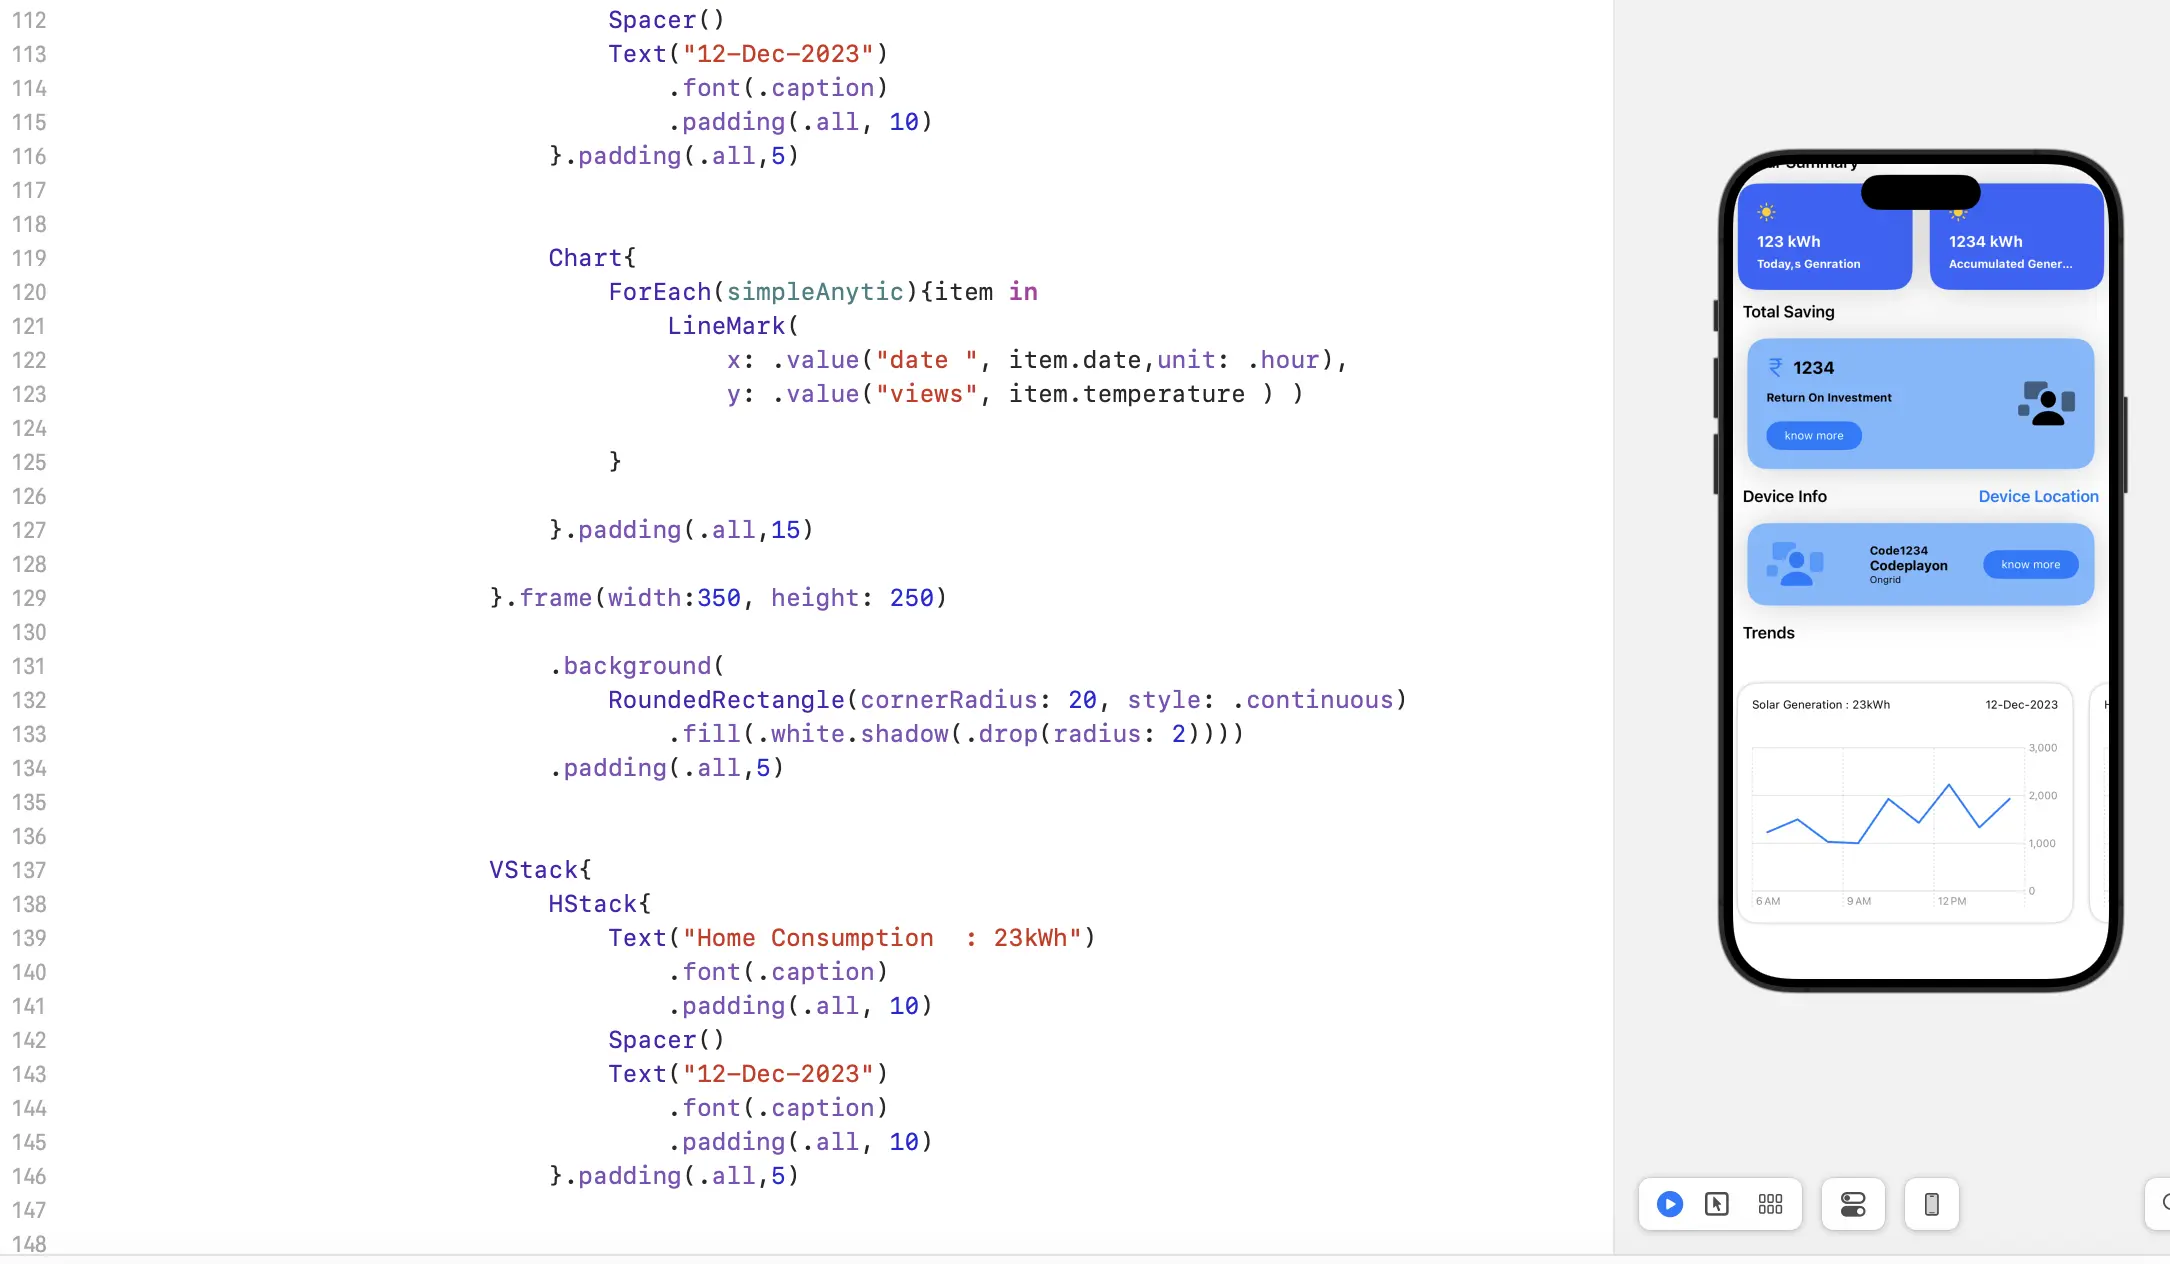
in your main view let make a design and add line chart in your view.
Chart{
    ForEach(simpleAnytic){item in
    LineMark(
      x: .value("date ", item.date,unit: .hour),
      y: .value("views", item.temperature ) )
       }
         }.padding(.all,15)
SwiftUi Multiple chart with with Horizontal Scrolling
lets adding multiple chart with horizontal scrolling.
import SwiftUI
import Charts

struct OverviewView: View {


    @State private var selected = 1
    @State var simpleAnytic : [ChartDate] = simple_date


    var body: some View {

                VStack(alignment: .leading, content: {

                    ScrollView(.horizontal, showsIndicators: false) {

                        HStack{


                            VStack{
                                HStack{
                                    Text("Total Install : 23K")
                                        .font(.caption)
                                        .padding(.all, 10)
                                    Spacer()
                                    Text("12-Dec-2023")
                                        .font(.caption)
                                        .padding(.all, 10)
                                }.padding(.all,5)

                                Chart{
                                    ForEach(simpleAnytic){item in
                                        LineMark(
                                            x: .value("date ", item.date,unit: .hour),
                                            y: .value("views", item.temperature ) )
                                    }

                                }.padding(.all,15)
                            }.frame(width:350, height: 250)
                                .background(
                                    RoundedRectangle(cornerRadius: 20, style: .continuous)
                                        .fill(.white.shadow(.drop(radius: 2))))
                                .padding(.all,5)


                            VStack{
                                HStack{
                                    Text("Active User  : 21K")
                                        .font(.caption)
                                        .padding(.all, 10)
                                    Spacer()
                                    Text("12-Dec-2023")
                                        .font(.caption)
                                        .padding(.all, 10)
                                }.padding(.all,5)

                                Chart{
                                    ForEach(simpleAnytic){item in
                                        LineMark(
                                            x: .value("date ", item.date,unit: .hour),
                                            y: .value("views", item.temperature ) )
                                    }

                                }.padding(.all,15)

                            }.frame(width:350 , height: 250)
                                .background(
                                    RoundedRectangle(cornerRadius: 20, style: .continuous)
                                        .fill(.white.shadow(.drop(radius: 2))))
                                .padding(.all,5)

                    }.frame(height: 300)
                        .transition(.move(edge: .bottom))
                })

       }
}

struct OverviewView_Previews: PreviewProvider {
    static var previews: some View {
        OverviewView()
    }
}
Also Read :
- How to create a Image Slider in SwiftUI ?
- how to create a SwiftUI Tabview : and Customize the Tab Bar