Hi in this flutter article, I am sharing how to design a flutter speedometer widget. Flutter is incredibly powerful for creating powerful UIs that display flawlessly across various structures and devices. First of all, you’ll require details about Flutter as well as Git as well as GitHub. If you don’t currently, you’re not using Flutter install, you can get an instance of it to your OS on their installation site.
Flutter from Google is a UI toolkit that lets you create beautiful and natively integrated web, mobile, and desktop applications using a concise time.
In this flutter example flutter speedometer widget, I am using dependency syncfusion_flutter_gauges:
syncfusion_flutter_gauges: ^20.4.50
syncfusion_flutter_gauges The Flutter gauges library includes a linear gauge and radial gauge (a.k.a. circular gauge) to create modern, interactive, animated gauges and radial sliders.
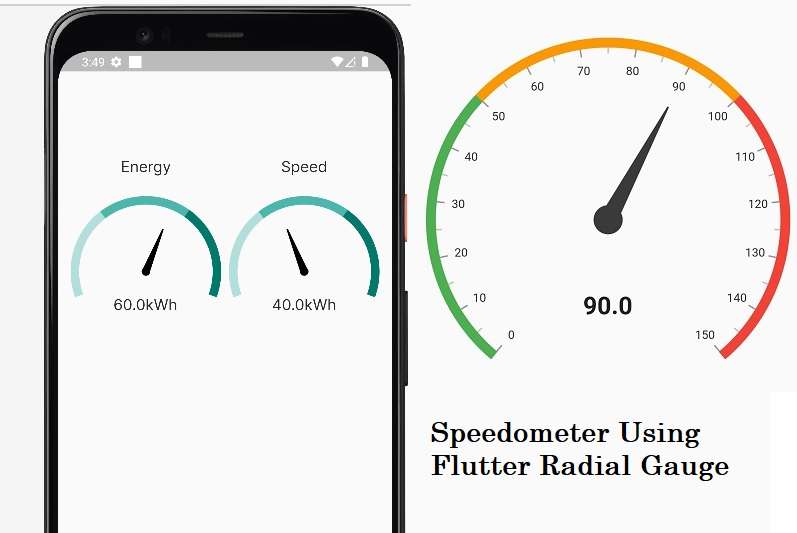
flutter speedometer widget example
So let’s start to make an example custom gauge flutter follow the below steps. For both Android and iOS apps to show the value on the chart flutter speedometer widget. Let’s Create a new flutter project and sync your project successfully and add a dependency in your pubspec.yml file.
Step 1: Add dependency in the pubspec.yml file.
add dependency in pubspec.yml file and get Pub to get dependency class access.
syncfusion_flutter_gauges: ^20.4.50
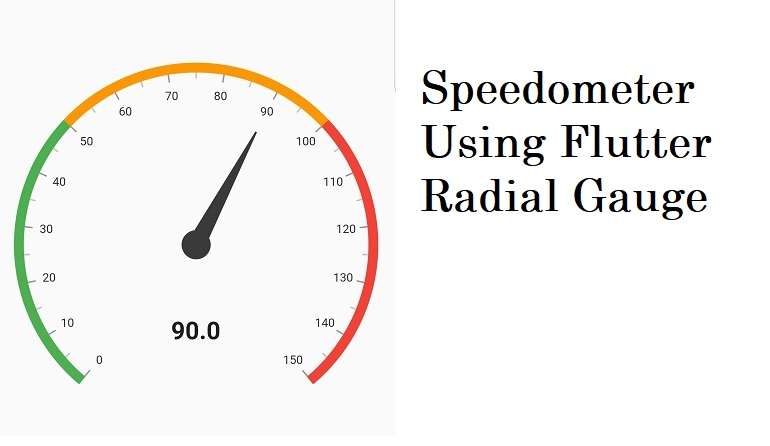
Add radial gauge elements flutter speedometer widget
Add the gauge elements such as axis, range, pointer, and annotation to display different color ranges, add a pointer to indicate the current value, and add an annotation to show the current value.
@override
Widget build(BuildContext context) {
  return MaterialApp(
    home: Scaffold(
        body: Center(
            child: Container(
                child: SfRadialGauge(
                    axes: <RadialAxis>[
                      RadialAxis(minimum: 0, maximum: 150,
                          ranges: <GaugeRange>[
                            GaugeRange(startValue: 0, endValue: 50, color:Colors.green),
                            GaugeRange(startValue: 50,endValue: 100,color: Colors.orange),
                            GaugeRange(startValue: 100,endValue: 150,color: Colors.red)],
                          pointers: <GaugePointer>[
                            NeedlePointer(value: 90)],
                          annotations: <GaugeAnnotation>[
                            GaugeAnnotation(widget: Container(child:
                            Text('90.0',style: TextStyle(fontSize: 25,fontWeight: FontWeight.bold))),
                                angle: 90, positionFactor: 0.5
                            )]
                      )])
            ))),
  );
}
syncfusion flutter Radial gauge features
Axes The radial gauge axis circular arcs in which the values are displayed on an axis line or a custom size in accordance with the design requirements. Axis elements, like labels or ticks, as well as the axis line, are easily customized using the built-in properties.
Ranges Gauge range is an image element that allows you to quickly determine where a value lies along the horizontal axis. Text can be easily noted by range, which improves reading comprehension.
Pointers to represent values on an axis. It comes with four kinds of pointers, including needle pointer marker pointer, and range pointer along with widget pointer. The pointers can all be altered as desired.
Animation – Animation of the pointer in a visually pleasing way as the pointer changes between values. The gauge can support a variety of pointer animations. Also, you can use an initial load animation to gauge.
Pointer interactions Radial gauge gives the option of dragging an object from one value to another. It also displays an overlay while you drag. It can be used to alter the value during runtime.
annotations – You can add multiple widgets like images and text as an annotation on a particular location in the radius gauge.
flutter speedometer widget Full Souce code
import 'package:flutter/material.dart';
import 'package:syncfusion_flutter_gauges/gauges.dart';
import '../../Utils/constants.dart';

class IncomingPage extends StatefulWidget {


  @override
  _IncomingPageState createState() => _IncomingPageState();
}

class _IncomingPageState extends State<IncomingPage> {


  @override
  Widget build(BuildContext context) {
    final ThemeData themeData = Theme.of(context);
    final Size size = MediaQuery.of(context).size;


    return Container(
      child: Stack(
        children:[
          Column(
            crossAxisAlignment: CrossAxisAlignment.end,
            children: [

              Container(
                height: size.height/3,
                child: Padding(
                  padding: EdgeInsets.all(10),
                  child: Row(
                    children: [
                      Container(
                          child:Expanded(
                            child: _getRadialGauge("Energy",60),
                          )),
                      Container(
                          child: Expanded(
                            child: _getRadialGauge("Speed",40),
                          ))
                    ],
                  ),
                ),
              ),

            ],
          )
        ] ,
      ),
    );
  }

  Widget _getRadialGauge(String Name,double vlaue) {
    return Center(
      child: SfRadialGauge(
          title: GaugeTitle(text: Name, textStyle: const TextStyle( color: COLOR_BLACK, fontWeight: FontWeight.w400, fontSize: fontsize18)),
          axes: <RadialAxis>[
            RadialAxis(startAngle: 160, endAngle: 20,showTicks: false,showLabels: false,
          interval: 10, ranges: <GaugeRange>[
              GaugeRange(
                  startValue: 0,
                  endValue: 33,
                  color: Colors.teal[100],
                  startWidth: 10,
                  endWidth: 10),
              GaugeRange(
                  startValue: 33,
                  endValue: 66,
                  color: Colors.teal[300],
                  startWidth: 10,
                  endWidth: 10),
              GaugeRange(
                  startValue: 66,
                  endValue: 100,
                  color: Colors.teal[700],
                  startWidth: 10,
                  endWidth: 10)
            ],
                pointers: <GaugePointer>[
                  NeedlePointer(value: vlaue,
                      needleStartWidth: 1, needleEndWidth: 5,
                      knobStyle: KnobStyle(knobRadius: 5,
                          sizeUnit: GaugeSizeUnit.logicalPixel, color: Colors.black))
            ],
                annotations: <GaugeAnnotation>[
              GaugeAnnotation(
                  widget: Container(
                      child: Text(vlaue.toString()+"kWh",
                          style: TextStyle( color: COLOR_BLACK, fontWeight: FontWeight.w400, fontSize: fontsize18))),
                  angle: 90, positionFactor: 0.5)
            ])
          ]),
    );
  }
}
Also Read :-
- gridview in flutter with image and text
- Flutter dart – How to make a custom TabBar
- Codeplayon Jetpack Compose Tutorial
- Codeplayon Android Tutorial
- Codeplayon Flutter Tutorial
- Codeplayon on Github